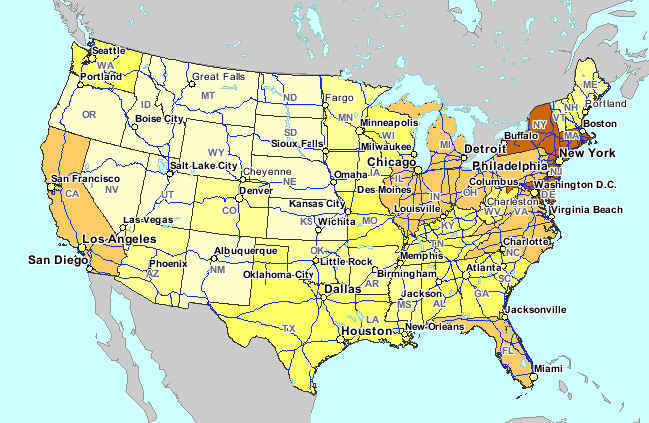
Thursday, October 9, 2008

Bilateral Graph

A Bilateral Line Graph plots two related variables and illustrates the intersection and overlap between the two.


Wednesday, October 8, 2008

Nominal Choropleth

A Nominal Choropleth Map is a choropleth map that does not use a scale of numbers as its differentiating criteria. Instead the data set is often words. In such maps, an assortment of colors can be used as the intensity of the color is not meant to indicate an intensity of data. In this example, each state is color coded based upon its political party leanings.


http://www.noddit.com/News/2008-Electoral-College-Map

Tuesday, October 7, 2008

Unstandardized Choropleth


Unstandardized Choropleth Maps do not aerially average data. The map shown here illustrates the number of Concentrated Animal Feeding Operations (CAFO) per state. In order to make this map standardized, the cartographer might have presented instead the number of CAFOs per square mile for example.

Monday, October 6, 2008

Standardized Choropleth Map


A Standardized Choropleth Map aerially averages data. This is generally preferable so that states or other areal units can be accurately compared.


This map shows the average annual pay per state in 1999.

http://www.jsu.edu/depart/geography/mhill/port/mw/choropleth.html

Saturday, October 4, 2008

Bivariate Choropleth


A Bivariate Choropleth Map overlays two sets of data on one choropleth map. The map shown here illustrates median house values (with dot shading) and 1997 population (with color variations) for Ohio counties.
http://gis.esri.com/library/userconf/proc99/proceed/papers/pap171/p171.htm

Friday, October 3, 2008

Unclassed Choropleth


An Unclassed Choropleth Map does not provide a scale or set number of classes into which states are categorized. There could be as many colors as there are states. In this instance, the intensity of the color is meant to indicate the intensity of data. The darker states in this map are shown to have a higher population density.


Wednesday, October 1, 2008

Range Graded Proportional Circle Map


Like Continuously Variable Proportional Circle Maps, Range Graded Proportional Circle Maps also demonstrate a given variable through the use of circles which are proportionally sized according to the quantity of the variable present at the location on the map. The difference is that Range Graded Proportional Circle Maps use a set number of circle sizes which correlate to a set range.


In this instance, each of the four circle sizes relates to a set quantity of zinc found in the Selwyn Basin, Yukon.