A continuously variable circle map demonstrates the quantity of a variable through the use of circles which vary in size according to the quantity of the variable at that particular point without limiting the size options for the circles. In other words, the size of the circle directly relates to the quantity of the measured variable.
The map below demonstrates presidential candidate endorsements by newspaper, with the size of each dot representing the circulation of the newspaper.
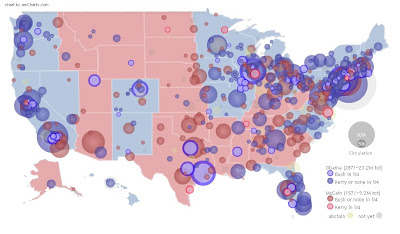 http://infochimps.org/static/gallery/politics/endorsements_map/endorsement_graph.html

No comments:
Post a Comment